• There is NO official Otland's Discord server and NO official Otland's server list. The Otland's Staff does not manage any Discord server or server list. Moderators or administrator of any Discord server or server lists have NO connection to the Otland's Staff. Do not get scammed!

Linux htop / perf top command for check cpu usage

roriscrave

Advanced OT User
Joined
Dec 7, 2011
Messages
1,188
Solutions
34
Reaction score
200
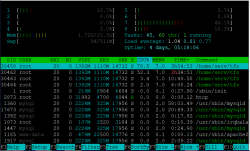
After use command 'htop', it show this:
But have 2 tfs with high cpu usage, what is the real usage? 78.5 or 52.3?
And about command perf top, what it show?
Obs: Using ubuntu

command htop
1587575862370.png

command 'perf top'
1587579507028.png


@Gesior.pl @fabian766 @Lessaire @Infernum
 
Last edited:
Solution
TFS is multithread application. On linux threads are counted as processes.

TFS - which run 4 processes (for one server) - is using 78.5% of power of 1 CPU core. Process with lowest PID is 'parent' of 3 'child processes' and htop shows all 4 processes CPU usage as CPU usage of this process.

top will show you just 1 process with name 'tfs' and it will be that process and it's 'CPU %' will show sum of all 4 processes.
78.5% is main (lowest PID number) process, which contains all other processes 'CPU' as part of it's own 'CPU'.
52.3 + 3.4 + 2.0 = 57.7 - other processes CPU
78.5 - 57.7 = 20.8 - CPU used
In 'main' thread is handled decryption of incoming network packages. I don't know, if you (or TFS authors) added anything else to it, because 20.8% CPU for decryption of packets is very high (should be below 5% when no one is attacking server with packets spam).

In 'htop' you can press F5 to turn 'tree view'. It will show you which process is owner (parent) of which. In this case processes 30462, 30463 and 30464 are child processes of process 30458.

I do not know if I understand it very well, the tfs is using 20.8% of the cpu?
and the way it is currently should I be concerned?
I also added about the 'perf' command in the main post, if you can explain it to me, you are very enlightening

edit: I currently put some code in the source that generates .log files so I can see the consumption of the scripts.
 
TFS is multithread application. On linux threads are counted as processes.

TFS - which run 4 processes (for one server) - is using 78.5% of power of 1 CPU core. Process with lowest PID is 'parent' of 3 'child processes' and htop shows all 4 processes CPU usage as CPU usage of this process.

top will show you just 1 process with name 'tfs' and it will be that process and it's 'CPU %' will show sum of all 4 processes.
 
Solution
It should be noted that htop is configurable, and the defaults are pretty terrible. Here, I spent two minutes and made this.

But really, since you are an Ubuntu user, do yourself a solid and do this.
Bash:
sudo add-apt-repository ppa:nicolashennion/glances
sudo apt-get update
sudo apt-get install glances
-- glances ppa
 
Back
Top