• There is NO official Otland's Discord server and NO official Otland's server list. The Otland's Staff does not manage any Discord server or server list. Moderators or administrator of any Discord server or server lists have NO connection to the Otland's Staff. Do not get scammed!

TFS 1.X+ High CPU usage in checkCreatureWalk (TFS 1.5 Nekiro 8.60)

Dolot2003

New Member
Joined
Dec 29, 2018
Messages
2
Reaction score
0
Hello everyone,

I'm currently running a server using the TFS 1.5 8.60 (Nekiro Downgrade) and I'm facing significant CPU performance issues when the player count increases. Looking at the internal profiler, it seems that the A* pathfinding algorithm and creature walking logic are consuming the vast majority of my CPU resources.

Here is my current server profile output:

[01/07/2026 13:31:05]
Thread: 1 Cpu usage: 69.4008% Idle: 29.6636% Other: 0.935578% Players online: 249
Time (ms) Calls Rel usage % Real usage % Description
11081 750833 53.22691% 36.93993% std::bind(&Game::checkCreatureWalk, &g_game, getID())
2461 33043 11.82279% 8.20511% std::bind(&Game::updateCreatureWalk, &g_game, getID())
1766 300 8.48225% 5.88675% std::bind(&Game::checkCreatures, this, (index + 1) % EVENT_CREATURECOUNT)


As you can see, checkCreatureWalk is responsible for over 50% of the relative CPU usage. With around 250 players online, this is causing noticeable lag spikes.

I know there are already plenty of threads on OTLand discussing pathfinding and CPU optimization, and I've spent quite a bit of time reading through them. Unfortunately, it's very difficult to find solutions that are actually relevant to TFS 1.5 8.60 (Nekiro Downgrade). Many of the suggested fixes are outdated, incomplete, or no longer apply to this branch, while others don't seem to have any measurable effect or introduce new issues.

Has anyone encountered this issue on the Nekiro downgrade? Are there any known optimizations, patches, or configuration tweaks to reduce the CPU load caused by pathfinding and creature walking without breaking the core game mechanics?

If you've managed to improve the performance of checkCreatureWalk or the A* pathfinding system on this version, I'd really appreciate it if you could share your approach or point me to a patch that has been tested and proven to work.

Any help or suggestions on how to profile or optimize this further would be greatly appreciated.

Thanks in advance!
 
I tested these changes on my server and saw a significant improvement.
std::bind(&Game::updateCreatureWalk, &g_game, getID()) and
std::bind(&Game::checkCreatures, this, (index + 1) % EVENT_CREATURECOUNT)
now use considerably less CPU than before. However, std::bind(&Game::checkCreatureWalk, &g_game, getID()) is still the biggest bottleneck and continues to consume around 36% CPU under heavy load. It would be great if this part could be optimized further as well.
 
Small correction: I wouldn't blame only A* here.

The profiler shows a movement pipeline bottleneck: checkCreatureWalk, updateCreatureWalk, checkCreatures, walk scheduling, follow/chase logic, spectator lookup, and repeated movement checks.

Replacing the A* implementation may help, but if checkCreatureWalk is being called hundreds of thousands of times, the main issue is also how often movement is scheduled and recalculated.

On Nekiro 1.5 8.60, this is expected under high load unless the movement logic, spectator filtering, and path recalculation rules are optimized together.
 
Last edited:
I would first recommend getting rid of the std::bind usage, in favor of passing a lambda like all the modern servers are doing.. that will be a nice help... but really, if you know anything at all about coding, then you are best off using your profiler to break down where the calls are coming from, and which parts of the calls are hot, so you can find the problem... just knowing that "X" process is the one consuming highest CPU usage doesn't give you much information to act on... you need to know which parts of that method are taking up the most cycles.. for that, you need a proper profiler, not that crap ass kondra nonsense... which, btw, is likely part of your problem in the first place, as using that system is just adding more overhead...

So to recap, drop std::bind usage, use a real profiler, and get rid of the kondra overhead nonsense on your task system... These are my personal suggestions... but other than that, you can find some more optimizations in blacktek, and I think the addwalk thing, I think I remember being able to make it more effecient by adding a "true" boolean as the second param to the call made to the monsters onThink, and that made a huge difference... but I can't recall if it made it called less or just made the monster more responsive... I forget... but yeah... use a real profiler to find the problems... because almost all methods have calls to other methods/functions, it's almost never as simple as "oh it's this one call that is high cpu usage"... it's, yeah ok, this call, which has like 3-4 places which are "hot".. as in, they are consuming high cpu cycles... and you will never be able to see this information with that ridiculous and worthless, kondra "stats system"...
 
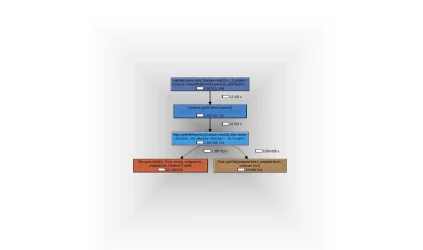
I performed a full analysis on my TFS using OTS Stats, internal performance metrics, Callgrind/KCachegrind, and controlled benchmarks.

OTS Stats was useful for locating the subsystem that required deeper investigation. Callgrind then exposed the actual inclusive execution chain:

Creature::requestFollowPathUpdate()
→ Creature::goToFollowCreature()
→ Map::getPathMatching()
→ Tile::queryAdd() / Floor::getTile()

In this capture, getPathMatching was executed approximately 12.5k times, while the searches generated about 1.38 million Tile::queryAdd calls and 2.66 million Floor::getTile calls.

The outer callback wrapper was not the root bottleneck. My current build uses a lambda through std::move_only_function, but the same principle applies to std::bind: replacing the callback wrapper alone would only remove minor dispatch overhead. It would not address path-request frequency or the millions of tile lookups and dynamic movement validations performed below it.

The work was therefore divided into separate problems.

The broader follow-path work addressed request scheduling, duplicate or stale updates, retries, and recalculation frequency. PR #177 specifically removes the persistent dynamic spectator-result cache and its global invalidation cycle, keeps spectator results live, reduces redundant monster target and idle refreshes, and reuses the active quadtree leaf and floor locally during each path search.

This local path lookup optimization does not cache walkability. Tile::queryAdd and all dynamic pathfinding checks remain active, so creature occupancy, fields, doors, items, instances, and other dynamic state continue to be validated live.

The controlled measurements currently documented in PR #177 are:

  • Map::moveCreature: 30.489 us to 8.738 us average in the same 24-move startup workload, approximately a 71% reduction.
  • 4096-tile lookup benchmark: 90.523 us with full quadtree traversal versus 28.606 us with local leaf/floor reuse, approximately 3.16x faster.
  • Live Map::getSpectators queries: approximately 5–10 us versus about 3.4 us for cached results.

The spectator result is an intentional trade-off. A single live lookup is slightly slower, but removing the persistent cache also removes stale-state risk, retained shared ownership, and broad invalidation work during creature movement. The total movement workload improved even though an isolated live spectator query became slightly more expensive.

Each tool had a different purpose:

  • OTS Stats located the subsystem requiring investigation.
  • Callgrind/KCachegrind identified real callers, callees, inclusive cost, self cost, and call volume.
  • Internal metrics measured calls, totals, averages, p95, p99, maximum latency, and slow samples.
  • Controlled benchmarks validated specific changes under comparable workloads.

Therefore, I agree that a detailed profiler is essential. Internal statistics are still valuable as an initial diagnostic and runtime validation layer. The improvement came from analyzing the complete pathfinding, movement, target-refresh, and spectator pipeline—not from simply replacing std::bind with a lambda.

These results are workload-specific and should not be interpreted as a universal server-wide CPU reduction.
 

Attachments

  • 1784214600643.webp
    1784214600643.webp
    22.1 KB · Views: 69 · VirusTotal
Last edited:
I performed a full analysis on my TFS using OTS Stats, internal performance metrics, Callgrind/KCachegrind, and controlled benchmarks.

OTS Stats was useful for locating the subsystem that required deeper investigation. Callgrind then exposed the actual inclusive execution chain:

Creature::requestFollowPathUpdate()
→ Creature::goToFollowCreature()
→ Map::getPathMatching()
→ Tile::queryAdd() / Floor::getTile()

In this capture, getPathMatching was executed approximately 12.5k times, while the searches generated about 1.38 million Tile::queryAdd calls and 2.66 million Floor::getTile calls.

The outer callback wrapper was not the root bottleneck. My current build uses a lambda through std::move_only_function, but the same principle applies to std::bind: replacing the callback wrapper alone would only remove minor dispatch overhead. It would not address path-request frequency or the millions of tile lookups and dynamic movement validations performed below it.

The work was therefore divided into separate problems.

The broader follow-path work addressed request scheduling, duplicate or stale updates, retries, and recalculation frequency. PR #177 specifically removes the persistent dynamic spectator-result cache and its global invalidation cycle, keeps spectator results live, reduces redundant monster target and idle refreshes, and reuses the active quadtree leaf and floor locally during each path search.

This local path lookup optimization does not cache walkability. Tile::queryAdd and all dynamic pathfinding checks remain active, so creature occupancy, fields, doors, items, instances, and other dynamic state continue to be validated live.

The controlled measurements currently documented in PR #177 are:

  • Map::moveCreature: 30.489 us to 8.738 us average in the same 24-move startup workload, approximately a 71% reduction.
  • 4096-tile lookup benchmark: 90.523 us with full quadtree traversal versus 28.606 us with local leaf/floor reuse, approximately 3.16x faster.
  • Live Map::getSpectators queries: approximately 5–10 us versus about 3.4 us for cached results.

The spectator result is an intentional trade-off. A single live lookup is slightly slower, but removing the persistent cache also removes stale-state risk, retained shared ownership, and broad invalidation work during creature movement. The total movement workload improved even though an isolated live spectator query became slightly more expensive.

Each tool had a different purpose:

  • OTS Stats located the subsystem requiring investigation.
  • Callgrind/KCachegrind identified real callers, callees, inclusive cost, self cost, and call volume.
  • Internal metrics measured calls, totals, averages, p95, p99, maximum latency, and slow samples.
  • Controlled benchmarks validated specific changes under comparable workloads.

Therefore, I agree that a detailed profiler is essential. Internal statistics are still valuable as an initial diagnostic and runtime validation layer. The improvement came from analyzing the complete pathfinding, movement, target-refresh, and spectator pipeline—not from simply replacing std::bind with a lambda.

These results are workload-specific and should not be interpreted as a universal server-wide CPU reduction.
waiting for official release 🫡
 
Each tool had a different purpose:

  • OTS Stats located the subsystem requiring investigation.
  • Callgrind/KCachegrind identified real callers, callees, inclusive cost, self cost, and call volume.
OTS Stats was redundant in this chain. It was unnecessary, because just as you could use your profiler to find the actual root cause, you would have been able to "identify the subsystem" with that same piece of software without a problem, and in fact, it would have only been a hassle to chase the call upward to that point anyways, which proves that it's not even that pertinent of information in the first place.

So my point about the stat system being useless, pointless, overhead... remains valid! You didn't find the true bottlenecks with that system, and in likely all cases, you won't find the cause of the bottleneck with that thing... it merely tells you, hey, yes you have some sort of bottleneck (with a point in the general direction)... that's all it does... but watching your CPU usage tells you when you have a bottleneck problem, for far less cost.

Anyways congrats on your own improvements on that I guess, you said it was PR #177, on what repo? TFS is up to thousands on their pr numbers now...
 
Back
Top