• There is NO official Otland's Discord server and NO official Otland's server list. The Otland's Staff does not manage any Discord server or server list. Moderators or administrator of any Discord server or server lists have NO connection to the Otland's Staff. Do not get scammed!

TFS 1.X+ Debugging on VS TFS

samco

4x4 Developer.
Joined
Jul 3, 2007
Messages
1,077
Solutions
9
Reaction score
260
Location
Spain
Hello, i wonder if it is possible to run debug mode in VS2017. I'm trying to achieve, but everytime i run debug, it seems the code cant load config.lua, so cant start the server properly.

Does anyone knows how to manage?

Thanks
 
try putting config file in proper location. The default should be right into vc14 folder
Well you are right, i forgot to mention that i changed the oputput folder, so the generated .exe is in the same folder as teh data and config file is
 
are you trying to debug after crash? just wait for it to prompt you to open with visual studio once it crashes and it'll work fine
 
are you trying to debug after crash? just wait for it to prompt you to open with visual studio once it crashes and it'll work fine
I don-t understand your question. I'm trying to debug the code from scratch nothing about a crash
 
He just wants to be able to set breakpoints and be able to trigger them I think.

Just start tfs and find option in menu at the top something like “attach to process” select tfs process and that shoud be it.
 
He just wants to be able to set breakpoints and be able to trigger them I think.

Just start tfs and find option in menu at the top something like “attach to process” select tfs process and that shoud be it.
I tried, but it always says that the compiled code is different, so it will never hit the breakpoints
 
I tried, but it always says that the compiled code is different, so it will never hit the breakpoints

Because you need to run debugger aganist same version of binary and source code. If you compile first and then change something in source code how is debugger supposed to know what part of binary is corresponding to what part of source code.
 
Because you need to run debugger aganist same version of binary and source code. If you compile first and then change something in source code how is debugger supposed to know what part of binary is corresponding to what part of source code.
It was a fresh compiled source code. Compiled, attached, not hitting code. But np, working on vc14 folder now
 
Probably I'm a bit late into the party (5 years only) but I'm sure this will help someone specially people that is learning or starting...

When you compile, you get the .exe together with a .pdb file
What is a .pdb file? It's the brother of the pdf ! ... Nah, it's a Portable Debug Database.
In short words, you own the code, you own a portable debug file and the .exe to run the code.

On the other hand we need something to inspect that code on runtime, put breakpoints, etc...
That's when the IDE comes in play. And I say IDE because you're not limited to Visual Studio only, neither to a specific version.

For example, I will run an old version OTHire which is adviced to compile with VC++ 2010 Express Edition: https://github.com/Ezzz-dev/OTHire/wiki/Compiling-under-Windows-(Visual-Studio-2010)
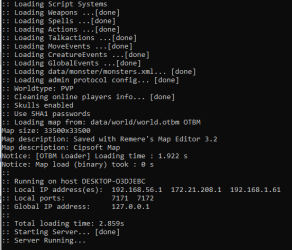
1697120594174.png

I know I can also compile with newest Visual Studio version:
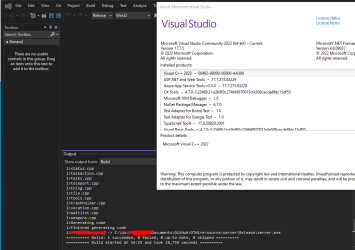
1697120932080.png

But for demo purposes, I will compile this one with VC++ 2010 Express Edition as per specification:
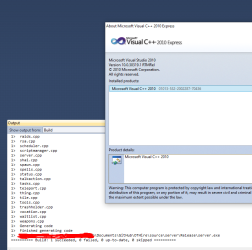
1697121088332.png

We put the .pdb file together with the .exe where the server is running:
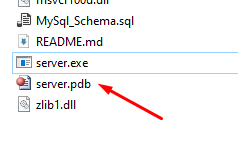
1697121163689.png
Then we attach the debugger to the running process:
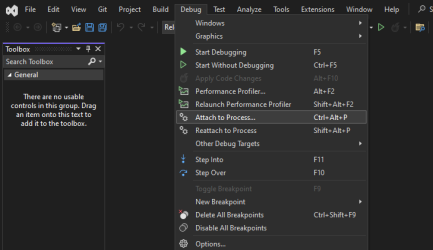
1697121231726.png

1697121313270.png

And we have the debugger connected:
1697121348896.png

As you see, we can compile with VC++ Express 2010 and we debug with Visual Studio 2022.

Now we can put breakpoints, jump into the code and debug normally. This is also very useful when you don't have the pdb files and you're getting errors in programs that you don't own the code.
 
Back
Top