• There is NO official Otland's Discord server and NO official Otland's server list. The Otland's Staff does not manage any Discord server or server list. Moderators or administrator of any Discord server or server lists have NO connection to the Otland's Staff. Do not get scammed!

useful tricks in Visual Studio for beginners

zbizu

Legendary OT User
Joined
Nov 22, 2010
Messages
3,323
Solutions
26
Reaction score
2,690
Location
Poland

Introduction​

This thread purpose is to get more people into experimenting with TFS sources.

Most beginners (and plenty of advanced users) prefer using Windows when it comes to running tfs locally.
This is not a disadvantage - most of user friendly tools to build a decent game world are for Windows (don't confuse building with hosting).
In this tutorial you will learn how to move around the code smoothly to make source edits far easier.

Note: I'm using a translated version of MS Visual Studio so the labels may be worded a bit differently in your language.

1. clicking some part of code and pressing alt+enter​

1624645106111.png
This shortcut opens a small menu that contains a plenty of features depending on what you clicked.
Might be helpful when you need to generate a declaration in header file or there is something wrong with the part of your code.

2. hovering over code parts​

1624645493013.png
1624645568833.png
Hovering over code parts can give you clues such as what the problem is (when underlined red) or what is the variable type (when ok)

3. right click menu​

This menu will be your best friend in source edits. It allows you to quickly jump between files to the functions you're looking for.
Even someone who is a complete beginner can move around smoothly using these. Below I will describe what each option does.
1624646580311.png
1. opens alt+enter menu
2. renames the selected part (variable, type, class name, etc)
3. allows you to view where the thing is defined without leaving the file you're currently editing
1624647211547.png
4. does a jump to a place where the thing you're checking is defined without opening peek window
5. does a jump to a place where the thing you're checking is declared (usually a header file - .h or first occurence of variable within a function)
6. gives you a list of places where the thing you're checking is being used. Useful to find out what is using the code you're editing.
The results of this action will show in bottom panel and when you click them, you jump to them instantly.
7. similar to previous one - lets you browse the code hierarchy in the bottom panel
8. performs a jump between .cpp and .h files related to each other
9. allows you to add a breakpoint in case you want to pause tfs and do some debugging

4. search feature (ctrl+f)​

allows you to search text like in browser, checks all files in the project
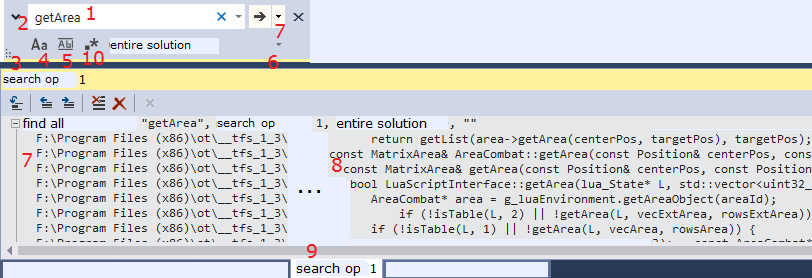
JD80Ytj.png

1. search box
2. toggle search/replace
3. resize the window
4. match case (if enabled, it will only search getArea and ignore things such as GETAREA and getarea)
5. entire words only (with this enabled, it will search for "getArea" only, while results such as "getAreaSomething" will be ignored)
6. the scope of your search
7. (the upper one because I put two by accident) clicking big arrow will move you to next result, clicking a small arrow allows you to choose previous/next/all results
if you clicked all results, they will be displayed in the bottom panel
7. (the lower one) path to file with the result
8. line containing the result
9. tab with the search. Number 1 means that this is the first search you've made in this session.
10. enable regular expressions

5. attaching a debugger​

Running tfs from Visual Studio may result in errors such as failing to load config, but that doesn't mean that you can't attach a debugger.
Start tfs normally, go to Visual Studio top panel -> debugging -> attach to process (or ctrl+alt+P)

QQBehBg.png

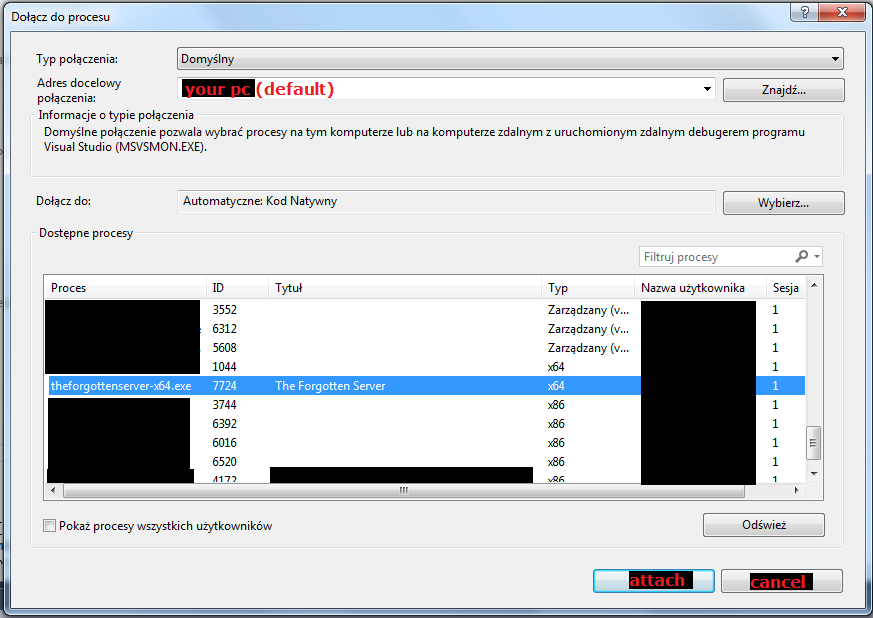
Here you can choose tfs executable from the list of active processes and wait for it to reach a breakpoint or crash.
In case of crash, you'll be moved to line of code where it happened.

The attaching menu may look confusing at first, but all you have to do is choosing tfs and confirming.
note: source code must match the executable for it to work

final words​

Don't get discouraged when you decide to make contributions and your code quality gets questioned.
When in doubt, just ask what needs to be corrected or how to contribute.
Every single one of us was figuring out the code convention of tfs repo and how to use git at some point.
 
Also CTRL+Left Click on a function/method to quickly jump to its declaration.
 
2021. Microsoft still can't show code with colors in search results:
1624654538745.png

Luckily there are JetBrains products. This is how search results should look like:
1624654718628.png
 
update on starting with debugger attached (the problem with loading files):

1. right click on the project (right panel) -> properties
1625525880079.png
2. debugging -> working directory
3. change $(ProjectDir) to $(ProjectDir)\..
1625525987940.png
4. now you can start it from top panel and it will load files from your server folder
1625526093633.png
 
how do i check debugg in linux? my server is randomly crashing after 20 hours and i don't what it could be
 
how do i check debugg in linux? my server is randomly crashing after 20 hours and i don't what it could be
Best way is to compile with debug symbols and then use gdb.
Code:
cd forgottenserver
mkdir build && cd build
--- rm -R * (if there are files in build already)
cmake -DCMAKE_BUILD_TYPE=RelWithDebInfo ..
make
cd ..
ulimit -c unlimited
gdb
file build/tfs
run
--- wait for crash
bt full
--- copy logs
quit
if asked, type Y

Running gdb this way requires SSH session to be up and online. If you close your SSH client then server will shutdown.
Best way around this if you want to close your SSH session (or don't want to leave your PC on 24/7) is to use screen.
Code:
screen -dmS debug -- create screen session named debug
screen -r debug -- attach to screen debug, use to to come back and check logs
cd forgottenserver
ulimit -c unlimited
gdb
file build/tfs
run
CTRL + a +d --- detach current screen (after that you can close your SSH client)
--- wait for crash
bt full
--- copy logs
quit
if asked, type Y
 
Last edited:
Best way is to compile with debug symbols and then use gdb.
Code:
cd forgottenserver
mkdir build && cd build
--- rm -R * (if there are files in build already)
cmake -DCMAKE_BUILD_TYPE=RelWithDebInfo ..
make
cd ..
ulimit -c unlimited
gdb
file build/tfs
run
--- wait for crash
bt full
--- copy logs
quit
if asked, type Y

Running gdb this way requires SSH session to be up and online. If you close your SSH client then server will shutdown.
Best way around this if you want to close your SSH session (or don't want to leave your PC on 24/7) is to use screen.
Code:
screen -dmS debug -- create screen session named debug
screen -r debug -- attach to screen debug, use to to come back and check logs
cd forgottenserver
ulimit -c unlimited
gdb
file build/tfs
run
CTRL + a +d --- detach current screen (after that you can close your SSH client)
--- wait for crash
bt full
--- copy logs
quit
if asked, type Y
thank you very much
Post automatically merged:

Best way is to compile with debug symbols and then use gdb.
Code:
cd forgottenserver
mkdir build && cd build
--- rm -R * (if there are files in build already)
cmake -DCMAKE_BUILD_TYPE=RelWithDebInfo ..
make
cd ..
ulimit -c unlimited
gdb
file build/tfs
run
--- wait for crash
bt full
--- copy logs
quit
if asked, type Y

Running gdb this way requires SSH session to be up and online. If you close your SSH client then server will shutdown.
Best way around this if you want to close your SSH session (or don't want to leave your PC on 24/7) is to use screen.
Code:
screen -dmS debug -- create screen session named debug
screen -r debug -- attach to screen debug, use to to come back and check logs
cd forgottenserver
ulimit -c unlimited
gdb
file build/tfs
run
CTRL + a +d --- detach current screen (after that you can close your SSH client)
--- wait for crash
bt full
--- copy logs
quit
if asked, type Y
this fucked up my host :/
 
Last edited:
sorry by spamming here, I'm debugging in windows 10 with msvc, if there is a posibility that my server is crashing by some script, the msvc compiler will display it too or nah?
 
sorry by spamming here, I'm debugging in windows 10 with msvc, if there is a posibility that my server is crashing by some script, the msvc compiler will display it too or nah?
It won't point the script but to a function that was executed.
 
double pressing ctrl can show variable types in function arguments
(avoid having this enabled when editing luascript.cpp, it gets really slow in that file)
1661641305670.png
 
(not really something super hidden, but imo worth mentioning for educational purposes)

When you start the compiled app through visual studio debugger, and it crashes, the place in which the program stopped will be marked with "x" symbol and a window with some context will pop up (1).
As you can notice, the file we are in is xtree, which is not a source file so we need to look into call stack (2) now.
1661700144998.png

The call stack window works like breadcrumbs, with most recent instruction at the top and places it got executed from - below it.
Double clicking on listed entry can take you to previously executed function. If it didn't, you can read the entry to see the name of the function.
(in my case, I called delete item; too early on purpose to show how the tool works)

As you can see in the call stack on screenshot below, there was something wrong in IOMapSerialize::loadItem, something to do with HirelingLamp class and the other part of the message says something about deletion. As you can see, both parts are present here.
1661700961581.png

example 2:
we are coding a feature for a specific kind of item, but forgot to check if obtained object exists before referencing it:
C++:
         HirelingLamp* hirelingLamp = item->getHirelingLamp();
         if (hirelingLamp->isUnpacked()) {

In screenshot below, you can see that the call stack is even more direct in this case, pointing to exact spot. From the bottom of the call stack we can read that we are in the dispatcher thread, in function mainLoader, which executed map loading, tried to load house items and crashed when unserializing an item that was in a house on the map, but wasn't an item belonging to HirelingLamp class.

In short what happened here:
  • item->getHirelingLamp() returned a nullptr
  • nullptr->isUnpacked() was called, causing a read access violation error
1661701453600.png

to fix that, we have to check if the object exists before referencing it, therefore our if should look like this:
C++:
if (hirelingLamp && hirelingLamp->isUnpacked())
 
Last edited:
Back
Top